Data collection
The inputs to Digital Gravelometer are images collected with a digital camera. To obtain accurate grain-size information from the software it is essential that appropriate procedures are followed when taking the photographs. If the results are to be meaningful, it is also essential that the sampling strategy is appropriate for the objectives of the project.
Sampling strategy
The sampling strategy encompasses the number of samples to be collected, and where, when and how to collect them. How to collect them in the context of analysis using Digital Gravelometer is discussed in the next section. It is impossible, here, to provide a manual on how to design a sampling programme; there is a large literature on this subject (pointers to which are included in the Important references section of this documentation). If you are uncertain about how to design your sampling strategy you should consult an experience practitioner.
However, there are some specific issues that should be briefly stated:
- Because Digital Gravelometer measures the sizes of grains in photographs it can only measure those grains on the surface. The subsurface sediment size distribution is unlikely to be the same as the surface distribution. Bunte and Abt (2001) provide an accessible introduction to converting surface to equivalent subsurface (volume) distributions and vice versa.
- Grain-size distributions may be generated by counting the number of grains or weighing them. Because Digital Gravelometer is based on measurements from photographs, it is unable to determine the weights of the grains and generates grain-size distributions based on grain counts. The most common surface sampling method, Wolman sampling, is based on grain counts.
- Surface grain-size distributions may be generated on an areal or grid basis. Areal samples measure all of the grains in a given area whilst grid samples measure those grains present at predetermined points. In an areal sample, the probability of measuring any individual grain in the sampling area is the same. In a grid sample, the probability of finding a grain of a given size at each point in the grid is proportional to its cross-sectional area. This difference means that the grain-size distributions produced by the two methods are not comparable. Digital Gravelometer provides the option to present the data in a format comparable to either areal and grid samples. The most common surface sampling method is the Wolman grid sample.
- Digital Gravelometer measures the grain-size distribution within individual photographs of sediment patches. Except in the extreme case where the patch is the object of study, these patches represent samples of the entire grain population of the surface being studied. The grains in individual patches may not be representative of the population of grains over the surface as a whole. It is good practice to sample several patches for each study surface. The number chosen will depend on the objectives of the study, the precision required and the resources available. The grain-size distributions of individual patches can be combined in the software to create an aggregate size distribution.
Guidelines for image collection
Camera selection
Any digital camera may be used to collect the images. However, the higher the pixel resolution of the camera, the larger the sampling area can be for a given minimum resolvable grain size. The camera should have a flash and ideally be able to drive an external, camera-mounted, flash. A flip-up display may help when composing the photographs. Image quality varies significantly between camera models and purchasers should take advice to ensure they acquire the highest quality camera for their budget. A good online resource, containing reviews of numerous models, is Digital Photography Review (http://www.dpreview.com/).
Sampling area
Size and shape
The principal control on the size of the sampling area is the requirement that the smallest grain of interest should be larger than 23 pixels in the image. Any grains smaller than 23 pixels will be subject to significant measurement errors. The graph below provides a handy reference to the largest sampling area recommended for a range of camera resolutions and minimum resolvable grain sizes.
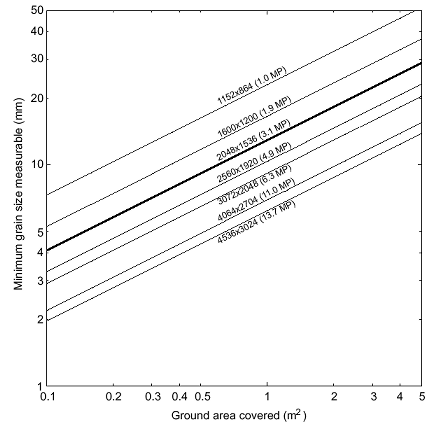
These relations may be summarised by the following equation:
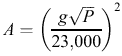
where A is the area photographed (m2), g is the b-axis of the smallest grain of interest (mm), and P is the number of pixels in the image. The graph and equation are only a guide and the quality of the camera will also have a bearing on the results achieved. Ideally, the shape of the sampling area should be rectangular to reflect the aspect ratio of the resulting image.
Marking the sampling area
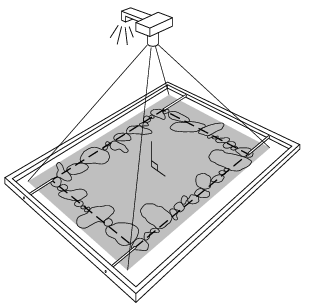
The four corners of the sampling area must be marked to define a rectangular area of known dimensions in the image. This may be achieved by laying a rectangular frame on the ground, marking the corner positions with adhesive targets or a marker pen, then removing the frame. Alternatively, an oversize frame could be used with pieces of wire protruding into the image to mark the corner positions. It is important that the frame itself is not in the image. The four markers will provide the scale and enable rectification of the image (to overcome perspective problems associated with the image not being collected with the camera sensor parallel with the surface). In the following sketch, the shaded area represents the area included within the image and the dashed line represents the sampling area.
Taking the photograph
Composing the image
It is important that only sediment (and the four markers defining the corners of the sampling area) is in the image (so, if you use an oversize frame, you must make sure it is not included in the image). This is because the image-processing procedure uses the image intensity frequency histogram to define its internal parameters and any non-sediment areas in the image may disrupt the operation of this stage of the processing. You must also ensure that any grains that intersect the boundary of your sampling area are entirely contained within the image. In other words, make sure the photograph is of a larger area than the sampling area.
There is no reason why the camera shouldn’t be held in the hand to take the photograph. A height of 1 – 1.5 m is fine (depending on the size of the area you are photographing; see also Illumination below). The use of a very wide angle lens setting (small focal length) should be avoided to minimise the effects of radial lens distortion.
The camera settings should be adjusted so that the pixel resolution is set to its maximum and images are stored as JPEG using the minimum compression supported. Leave all other parameters at their default values. The aperture and exposure settings determined by the camera should be fine.
Illumination
It is essential that the sampling area be protected from direct sunlight and a flash used. Sunlight casts deep shadows and will interfere with the grain recognition procedure. If possible, use a camera-mounted external flash to increase the overhead lighting intensity. Use of a flash may result in uneven illumination across the image. Efforts should be made to avoid this. The probability of such problems deceases as the distance between the camera and the ground is increased.
Surface conditions
The sediment should be dry to prevent strong reflection of the flash. It doesn’t matter if the interstices are damp or if there are a few rain spots on the grains.
Treatment of the images
After downloading the images from the camera, avoid modifying them in other software. Repeated opening and saving of JPEG images results in degradation of the image quality. More importantly, the images will probably contain metadata (e.g. focal length, exposure settings, date) that is not preserved by many imaging software packages.
Image collection checklist
A printable image collection checklist (PDF) is provided for use in the field. Most computers automatically open PDF documents, but you may need to download Adobe Reader.